Looking at Range Ecology as a Network
The following is a convoluted attempt to capture and visualize many of the relationships involved in rangelands. While certainly not exhaustive, the objective was to at least demonstrate representative relationships taking place on the landscape.
Relationships are depicted by a combination of “nodes” , which are any factors capable of influencing any other factor, and “edges” (the lines between nodes) which indicate the direction(s) of that relationship. The information shown regarding the nature of the relationship is limited to what can be expressed with a line and an arrow. Some edges have arrows at both ends indicating that the relationship goes both ways. For example: Grazing influences where fire may occur, while fire affects where grazing is likely to occur.
These visualizations are intended to be interactive. With the mouse you can grab the whole figure and move it around as well as grab individual nodes and drag them to see how they are connected. The groups available in the drop down menu are classifications of the nodes based on whether they were considered to be abiotic, biotic, disturbances, or interactions, or possibly a combination of those. The groups are represented by colors in the plot. The width of the lines represents the degree of influence in the relationship. Thinner lines represent factors that are further removed from the target node. (There is a bit of flaky behavior here.) While not an ideal classification, it still seems to be useful - not every node fits cleanly in one category.
As of 2022-03-11 there are 130 edges (lines) and 26 nodes.
Caveats: This is a work in progress - and has been for a couple of years. Most of the effort so far has been in getting the visualization worked out, so, as it develops, the nodes and relationships may change. I’ve already changed how I think about some of them in the process. The whole exercise has been useful in helping me to clarify how I viewed the components of rangeland systems.
Abiotic Factors in Rangelands
Climate is a function of location relative to large scale features like mountains and oceans and particularly, ocean temperature. Climate and Geology determine Topography. Topography, Geography and Precipitation determine the physical properties of Soils. Seasons result from the tilt of the earth on its axis and its rotation around that axis, but are influenced by Climate. Climate influences Weather patterns - wet/dry season etc. Seasons influence Weather, which in turn dictates Wind, Precipitation, Temperature and Humidity. Humidity is a result of past Precipitation, vegetation mass and condition, and is influenced by past and current Temperatures. Humidity moderates temperature - in other words, high humidity values result in lower high temps and higher low temps.
Biotic Factors in Rangelands
All of the biotic factors arise as a result of interactions with other factors - abiotic, biotic or disturbances. That being the case, there remain only secondary (blue) and tertiary (tan) biotic factors. Complexity of dependencies defines the difference between the two. Any number of taxonomic groups could be added in here but would likely just increase the visual complexity of later graphs without contributing any new types of relationships.
Interactions in Rangelands
As I’m using them here, interactions are those things taking place on the landscape that can’t be attributed to a single source but are the result of several inputs. Some of these may be processes such as nutrient cycling but others, like fire behavior are harder to define. Another aspect of these interactions seems to be that the relationships between them are complex - any one relationship is the result of multiple factors. As an example, fire behavior can influence runoff but is dependent on the amount of litter, soil moisture, season of burn, and other factors. Of the interactions listed it appears that land managers might have the most influence over fire behavior - at least in the short term. We can determine the season of burn and burn conditions which are likely to influence a number of other interactions.
Disturbance in Rangelands
Grazing Behavior is categorized here as a disturbance, but keep in mind that it has a lot of biotic components as well. My classification scheme just doesn’t account for this. I’m surprised it worked this far. Otherwise, the graph is simply to pull out and focus attention on the types of disturbances in rangelands. Later graphs show how they tie in. This is the first appearance of disturbance so far, at least directly. While they both can certainly influence fire, grazing behavior and drought do so by reducing fuel load so they don’t get linked directly back to fire. In other words, both grazing behavior and drought are temporally separated from the fire. The reduced fuel load is present during the fire.
Abiotic Factors and Disuturbances
There’s not anything real exciting going on in how abiotic factors interact with disturbances but it does provide some contrast for the following section.
Biotic Factors and Disturbances
As we start to look at how disturbances and biotic factors interact the complexity goes up rapidly. The influence of drought on fuel load is pretty straightforward although there are other factors with drought that aren’t detailed here. One distinction to pay attention to in this graph is the two types of biotic factors. Fuel load, in blue, is a “secondary biotic factor.” This classification is based on the factors contributing to its nature, in this case most are biotic and something beyond individual species like vegetation type etc. The other type is “tertiary” biotic which indicates that those nodes are dependent upon “secondary biotic” factors. Tertiary factors would be highly related to things like habitat structure. Notice the feedback loops with the tertiary biotic factors (tan). While grazing behavior influences dung beetle distribution and abundance, dung beetles also influence grazing behavior by moderating manure avoidance during grazing. With grassland birds, while they definitely impact dung beetle abundance through predation - the beetles are providing valuable resources to the birds.
Interactions and Disturbance in Rangelands
Similar to the groups of biotic factors above, interactions are here grouped into 3 levels. These would resemble how trophic levels work. Primary interactions are likely to have simpler relationships that may be single processes or factors while secondary and tertiary interactions are dependent upon or influence groups of interactions. For example, biodiversity, a tertiary interaction, is dependent on and influences soil health, a primary interaction, and it plays a part in plant species, a secondary interaction.
There are a couple of interesting observations here. First, is the number of interactions occurring at most of the nodes. There are a lot of things going on. The second involves drought. It is pretty obvious how drought might impact soil moisture, but how does it influence biodiversity? Drought tends to open the canopy through reduced production and mortality of individual plants. This exposes more soil to sunlight. There are some plants that require those conditions to grow. As an illustration, in the three years of vegetation sampling on a large range project prior to 2012, Silene antirrhina had shown up in a single quadrat. A severe drought began in 2011 and continued through 2012. In 2012, Silene was again seen, but in quite a number of quadrats this time. The following year it turned up in nearly every quadrat sampled. It wasn’t seen again in the following 3 years of sampling. Grazing and burning treatments didn’t seem to have any effect on its occurrence. So drought does influence biodiversity but sorting out exactly how is problematic.
Interactions and Biotic factors
The biotic components of rangelands seem to center around the Plant Species but I suspect that growth habit might be a large part of that. I’m not certain what the effects are of a missing species (a big perennial grass) that gets replaced with an introduced species with similar growth habits. If it meets their needs, do the grassland birds care? What about other species and particularly what happens in the soil in those circumstances? The plant species, vegetation type, and soil moisture determine forage production which then has a profound effect on potential fuel load. I expect that plant species are having tremendous effects on the soil biota but I’m a little fuzzy on that - kind of out of my wheelhouse and I suspect it may need a graph all its own.
Biodiversity is harder to sort out. In the context of enhancing ecosystem stability, the effects of biodiversity are pretty straightforward. When trying to convince an old rancher why he needs to manage to improve biodiversity, the popular answer seems to be “Well, birds and butterflies and such!” but few hard answers. Regardless of a land manager’s latitude or longitude in the Great Plains, there are always a handful of highly productive native grasses that they would like to manage for. The problem is that those species tend to be late seral species. They require a certain threshold level of biological complexity in the soil to complete their life cycle. So, if high seral grasses are the management objective, managing for biodiversity in the soil is how those necessary threshold levels can be reached. This idea probably isn’t restricted to the soil and so likely applies to most of the later seral species in rangelands regardless of the taxa (birds, beetles, etc).
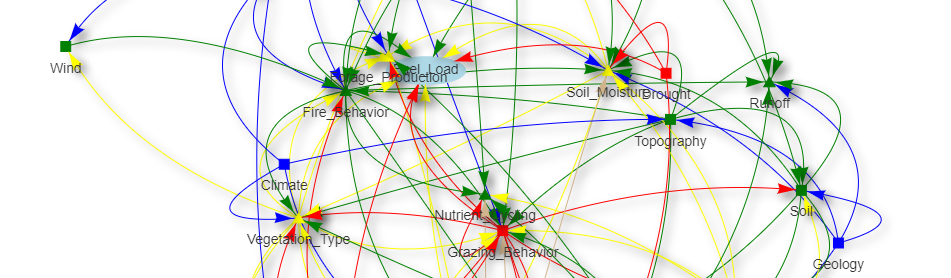
The Whole System… or at least a lot of it.
Putting the entire system together begins to look like a web built by a spider that’s been indulging in recreational chemistry. Something that is apparent, even in this mess, is the number of connections (edges) that a few of the nodes have. Forage production (9 edges), vegetation type(17), soil moisture(16), plant species(18), and soil health(12) all have an abundance of connections. As managers though, there’s not a lot we can do to directly influence any of those to any great extent. However, we might have more success with a couple of the other nodes. Grazing behavior(20) can be directly managed and can have a dramatic impact on several other nodes. Fire behavior(18) is another that can be directly managed using prescribed fire. Through the use of grazing and prescribed fire, most of the biotic factors and interactions can be affected, depending on how these practices are applied by managers.
So, in the end, it all comes down to how we graze and how (or if) we apply fire to the landscape.